
A Guide to generative BI Topics with AWS Quicksight
October 10, 2025A couple of years ago, I attended an AWS Quicksight workshop. I promptly forgot what I learned 🫠. Two years later this missing knowledge would have been useful, so I went back and re-learned it. As it turned out, a lot had changed in those years, and generative BI had been integrated into Quicksight. It was new, it was shiny, and so the ‘connect your data sources to quicksight` blogpost was abandoned 🤷🏻♀️
What is Generative BI?
You might not have heard of generative BI, but you will have heard of generative AI (whether you wanted to or not). While generative AI creates new content, such as text, images, or music, based on existing data. Generative BI applies this concept to business intelligence, hence ‘BI’. In practice this results in the ability to extract meaningful insights and reports from data via natural language queries.
In AWS Quicksight, generative BI features allow you to build visuals, ask questions about visuals you’ve created, and get executive summaries and explanation for what is presented (see Data Stories). It can provide dashboard viewers with the ability to ask questions about the data in their dashboards, to reveal insights and trends (Dashboard Q&A), and you can also use the Scenarios feature to develop forecasts based on your existing data to inform decisions. Or you can simply use it to help you build calculations in your analyses.
What I want to focus on though, is Quicksight Topics. Topics are the foundation that underpins many of the other generative BI features in Quicksight.
What is a Quicksight Topic?
A Quicksight Topic is a semantic layer that sits on top of your data. It allows you to define business terms and metrics in a way that is meaningful to whoever is working with that data, or its results. Once a Topic is created and filled out, users can use familiar terminology, rather than technical jargon or weird unclear variable names when working with their data. Why say nwslt_im_col_2576_new when you can say newsletter colour?
Quicksight Gen BI Prerequisites
If you want to use generative BI features in QuickSight there are some pre-requisites first:
- You need to have an AWS account.
- You need to have Quicksight enabled in your AWS account.
- You need to have Quicksight enterprise edition (there is a 30 day free trial if you want to try it out).
- You need to have the ‘Author Pro’ access role (currently 50 dollars per user per month)
⚠️ As soon as you have a quicksight pro user, you inherently have enabled generative BI features for your quicksight account, even if only that one pro user is able to use those features. At the time of writing, the enablement costs 250 dollars per month. ⚠️
Also note that not all regions are supported, the current list of supported regions can be found here.
How to create a Quicksight Topic
Quicksight has several sample datasets you can use to play with topics. I’ve used the Campaign Ads And Spendsample here but you can use any dataset you like.
To create a topic:
- Go to the Quicksight app in your AWS account
- Select
Topicsfrom the left hand menu - Click on
New Topic - Select the Marketing Campaign (or another) sample dataset
Filling out the Topic
Once you’ve selected your dataset, you can start filling out the topic. You can give it a name and description, then you can start adding business terms and metrics.
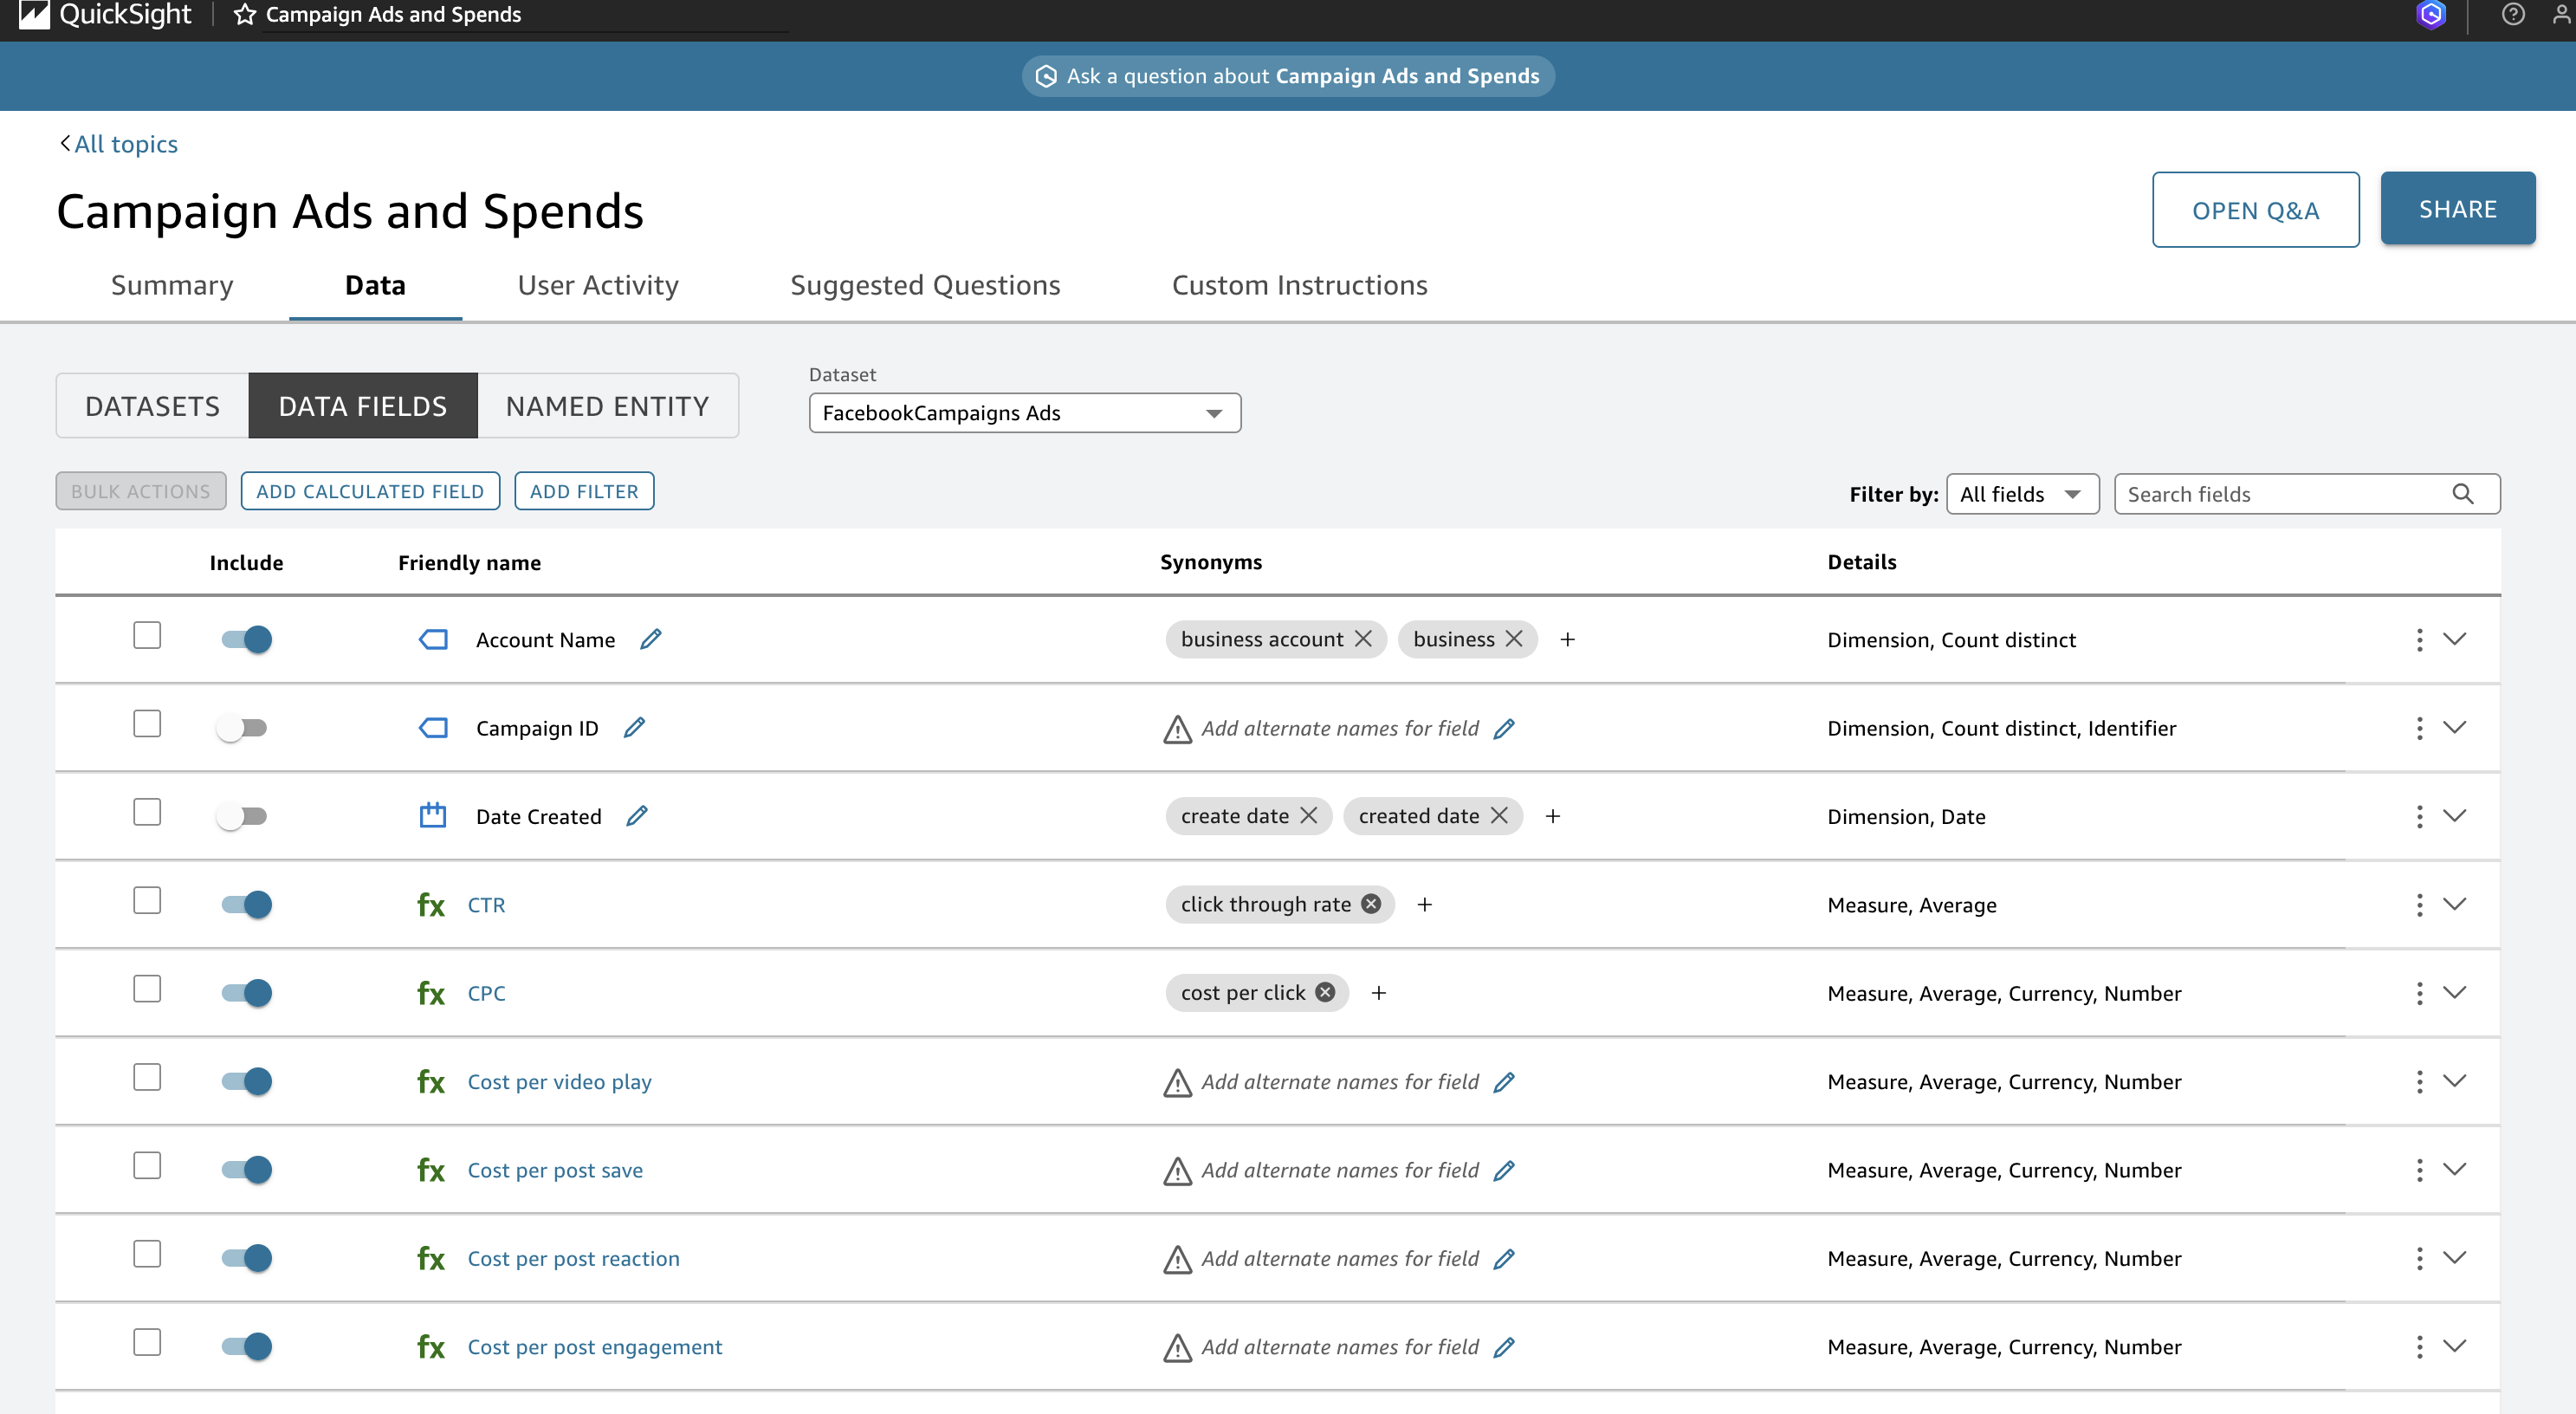
- Click on the Datafields tab after opening your topic
- Click on a field to see existing details about that variable
- Look at the
friendly namecolumn, edit the field name for any fields in your dataset that you want to be able to refer to in natural language queries. - If you want to be able to refer to a field in more than one way, you can add synonyms for the field name.
- You can also provide a description for each field, which will be useful when you or others are trying to understand what the field represents later on.
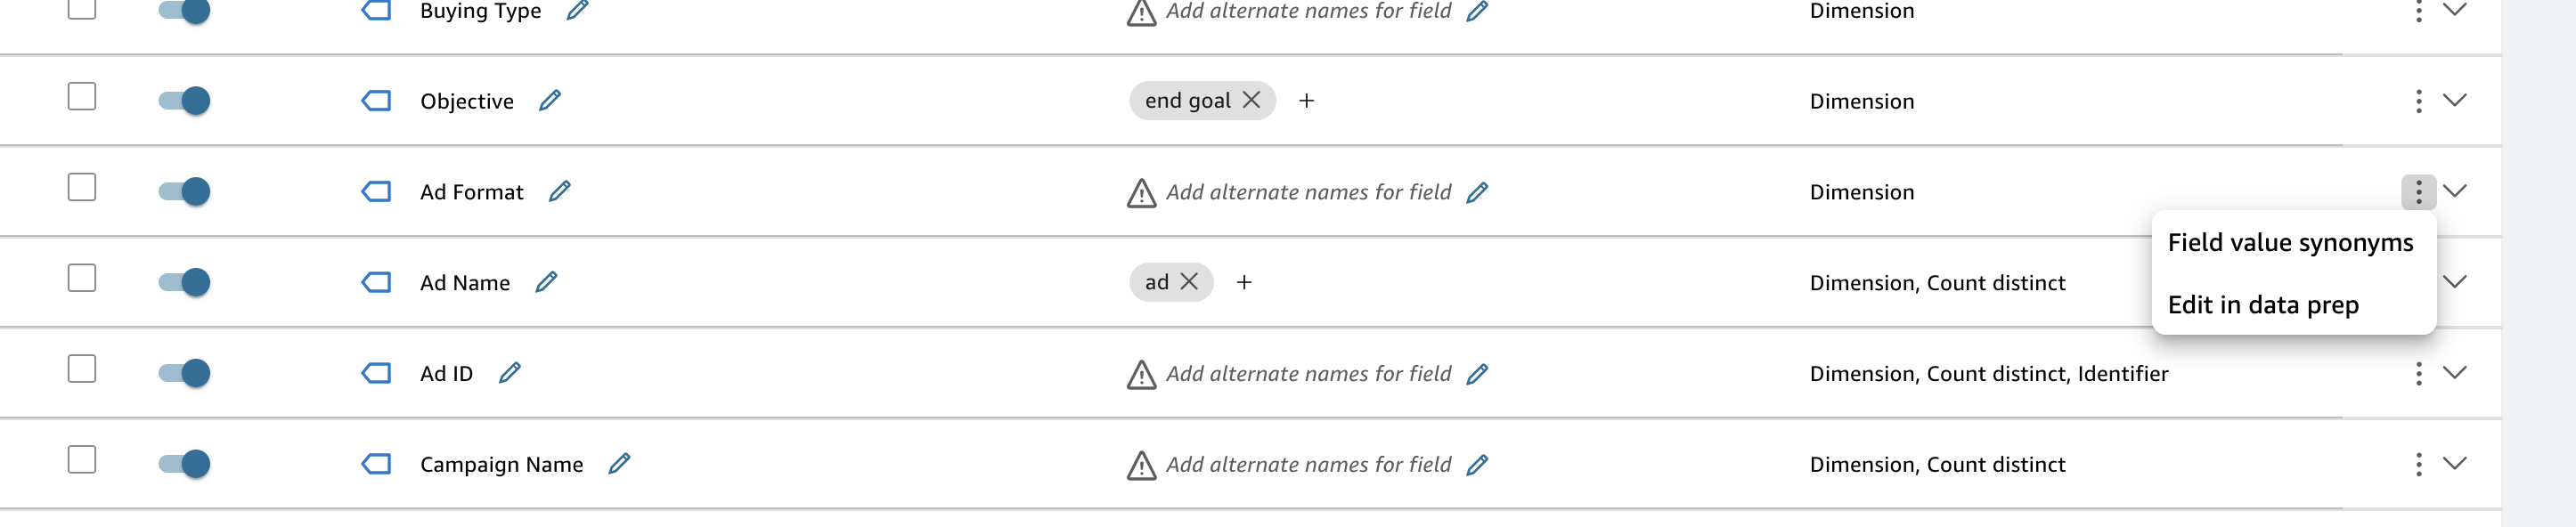
Often you will have fields in your dataset with values that are not very user friendly, for example a field called Region for a german dataset might have values like NRW, HH, BE for the german states. You can create a value set to map these values to more user friendly terms. So that you can ask questions like What is the campaign spend in Hamburg? instead of What is the spend in HH?
- To edit the value synonyms, find the field name
- Click on the three dots at the end of the row
- Select
Edit value synonyms - Click add synonym
- Select the value you want to add a synonym for in the dropdown
- Type in the synonym you want to use
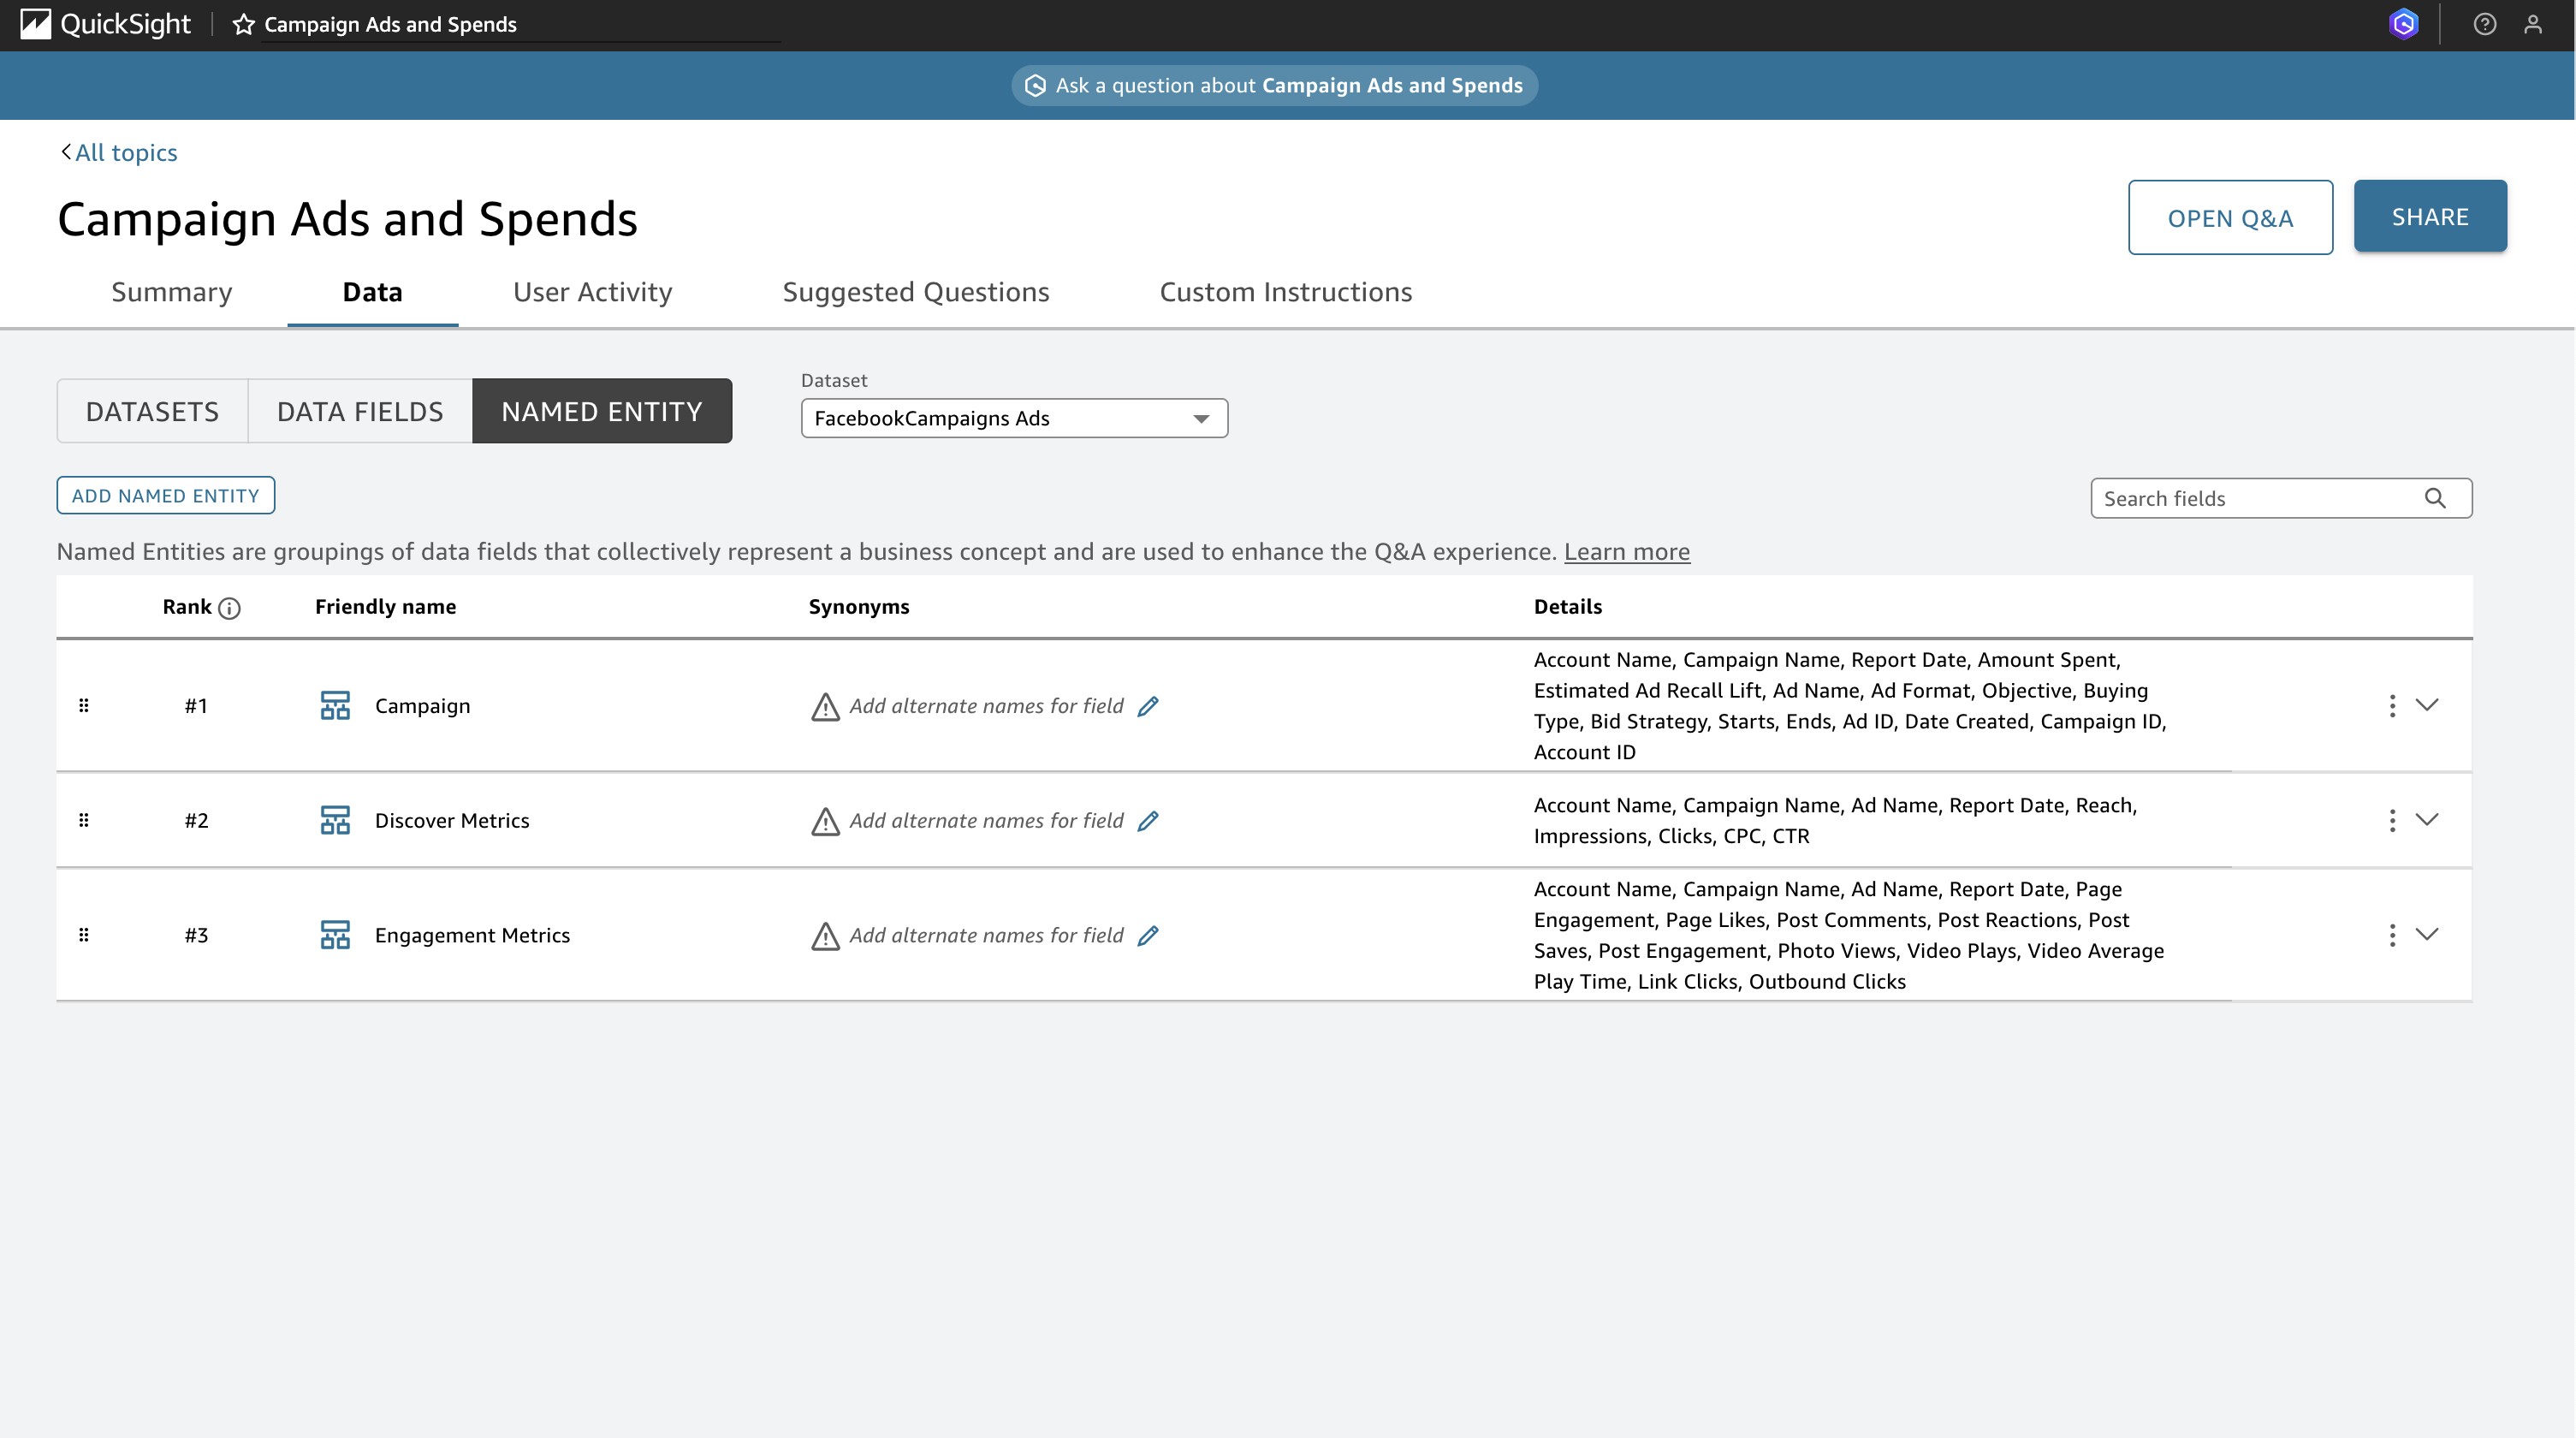
Named entities
Named entities are a way to group related fields together. For example, in the marketing campaign sample dataset, there is the ’engagement metrics’ named entity, that includes fields like video average playtime, link clicks, and page likes. This allows you to ask questions like What is the engagement by campaign? instead of having to specify each field individually.
We can create our own new named entity for cost metrics:
- Click on the
named entitiestab - Click on
add named entity - Call it
cost metrics - Add fields such as
cost per page engagement,cost per thousand clicks - include dimensions you want to group by, such as
campaign nameandad format - Click on
create named entity
Exploring your data
Now that you have your topic set up you can test it out. Try out using synonyms and named entities that you’ve created.
Click on the Q&A button in the top right and type in a question or use one of the suggestions.
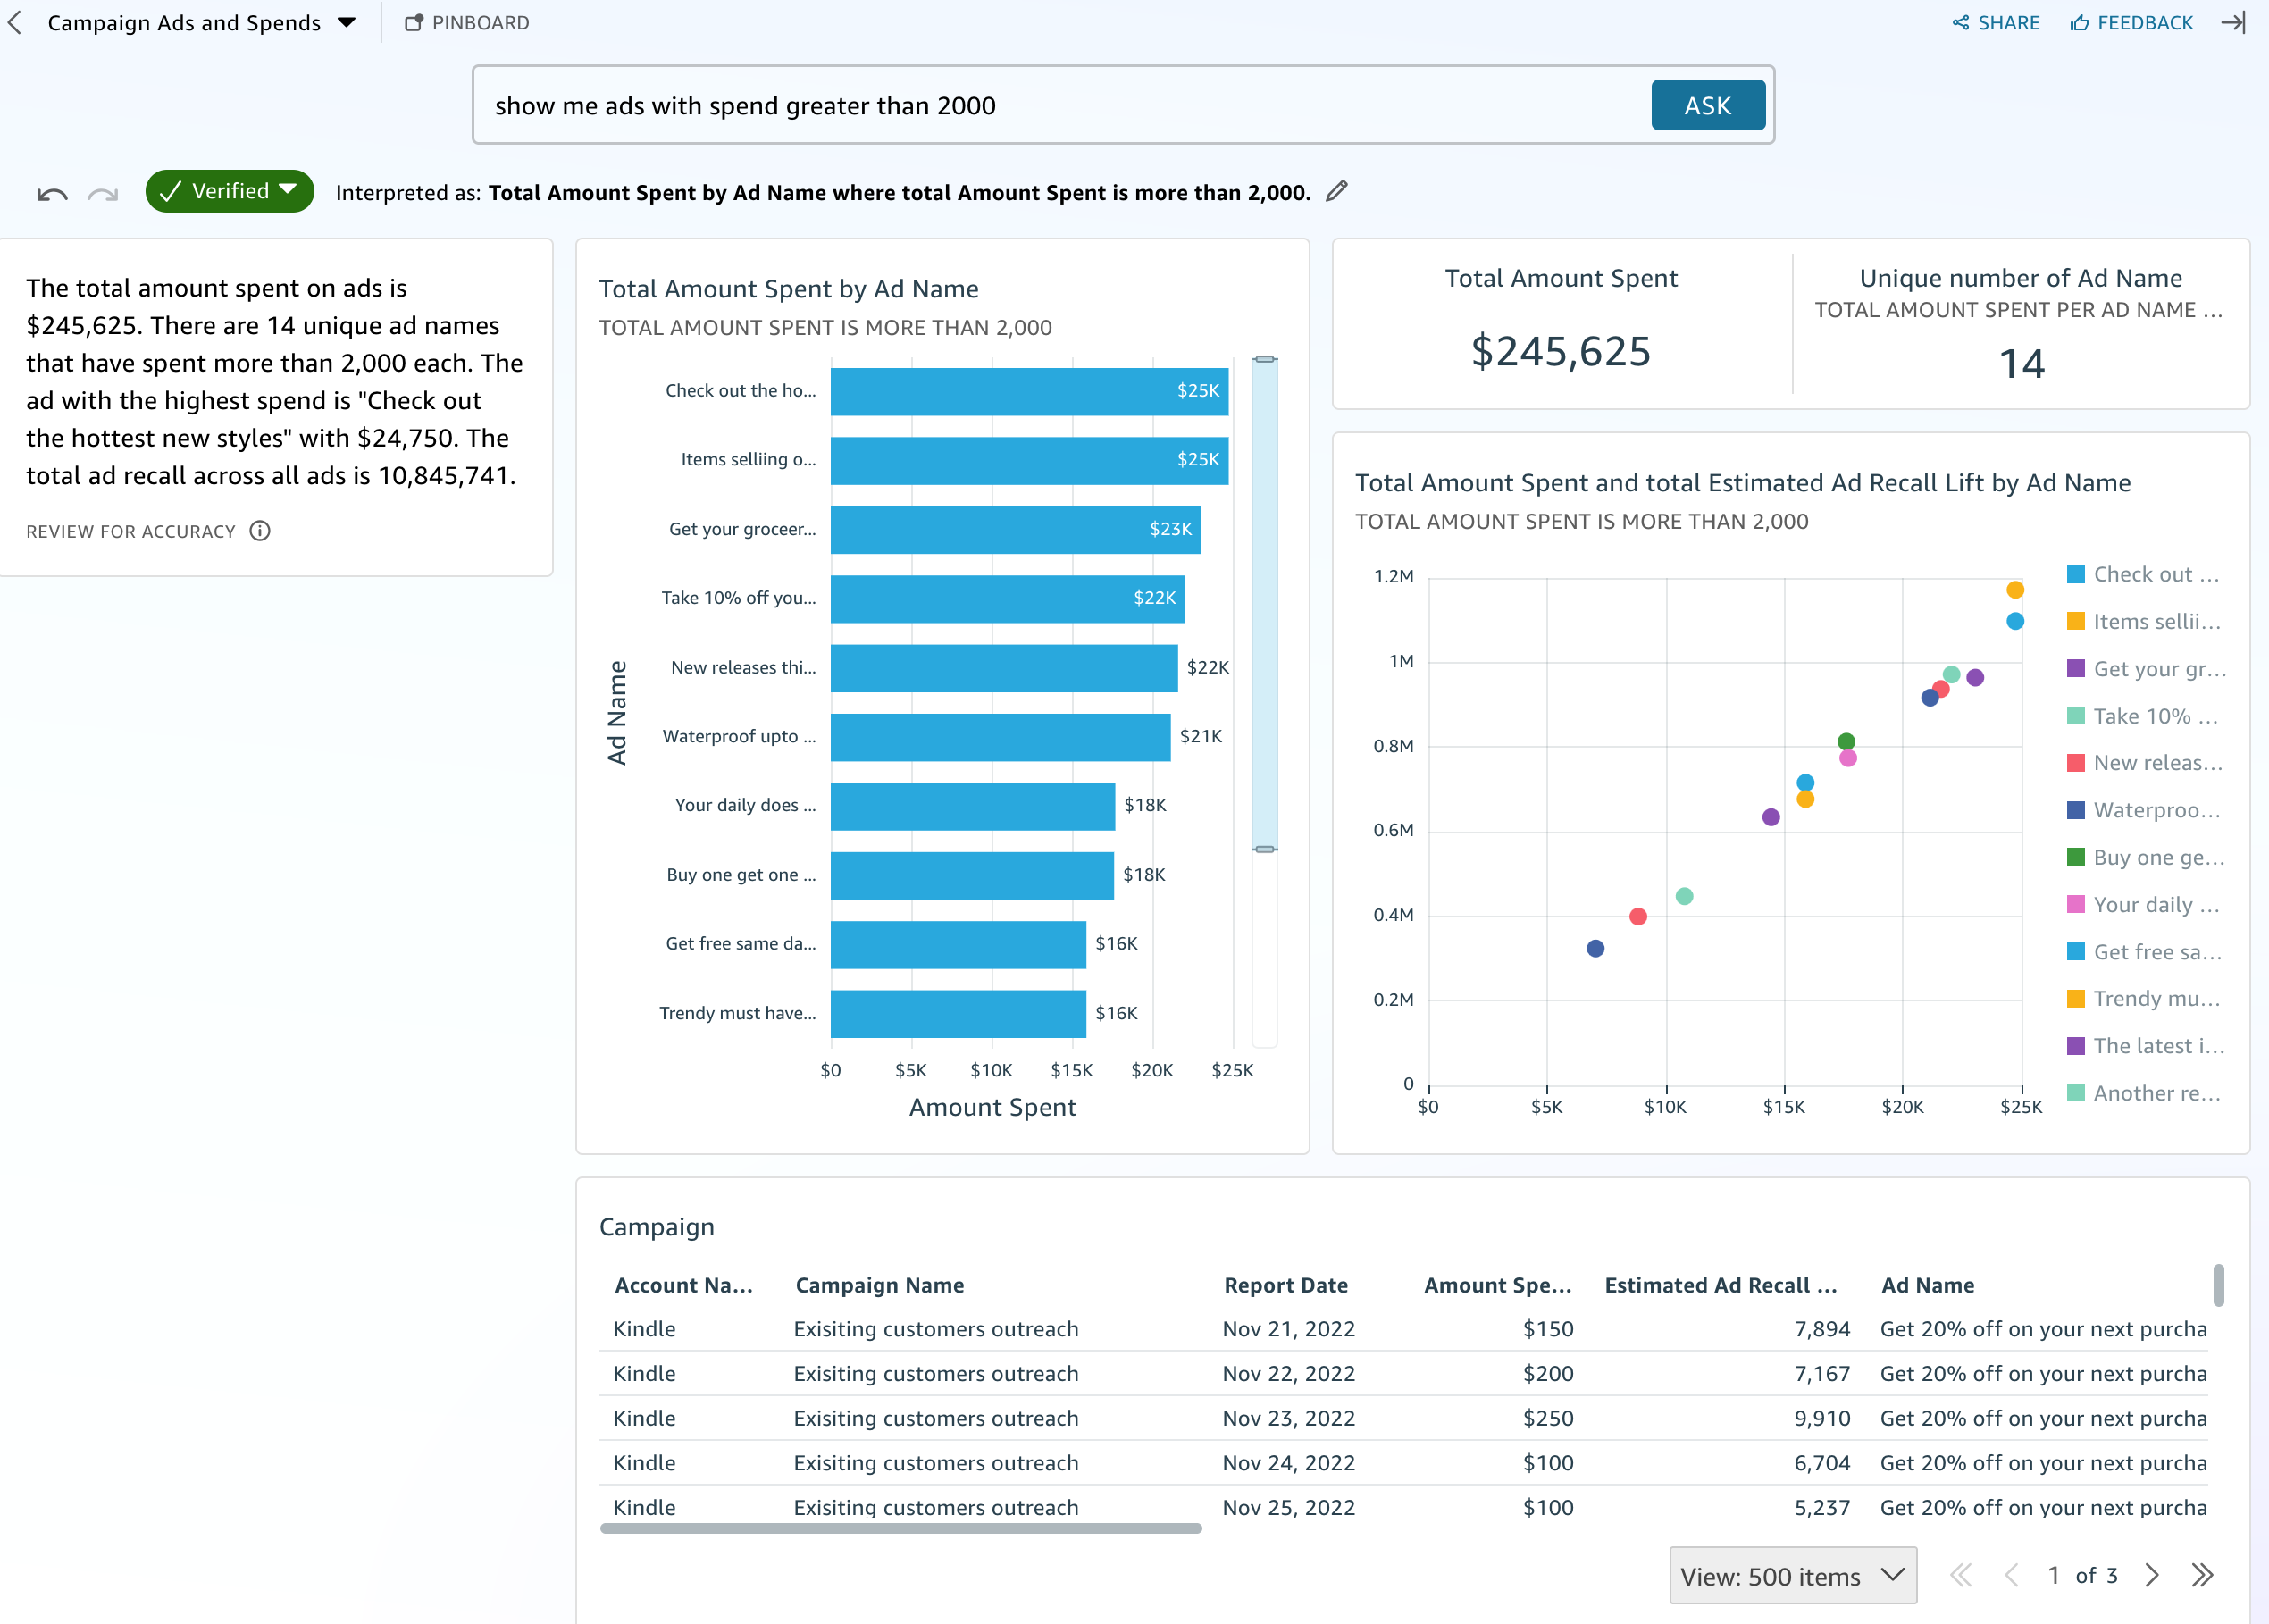
You should get something like the above depending on what you were asking.
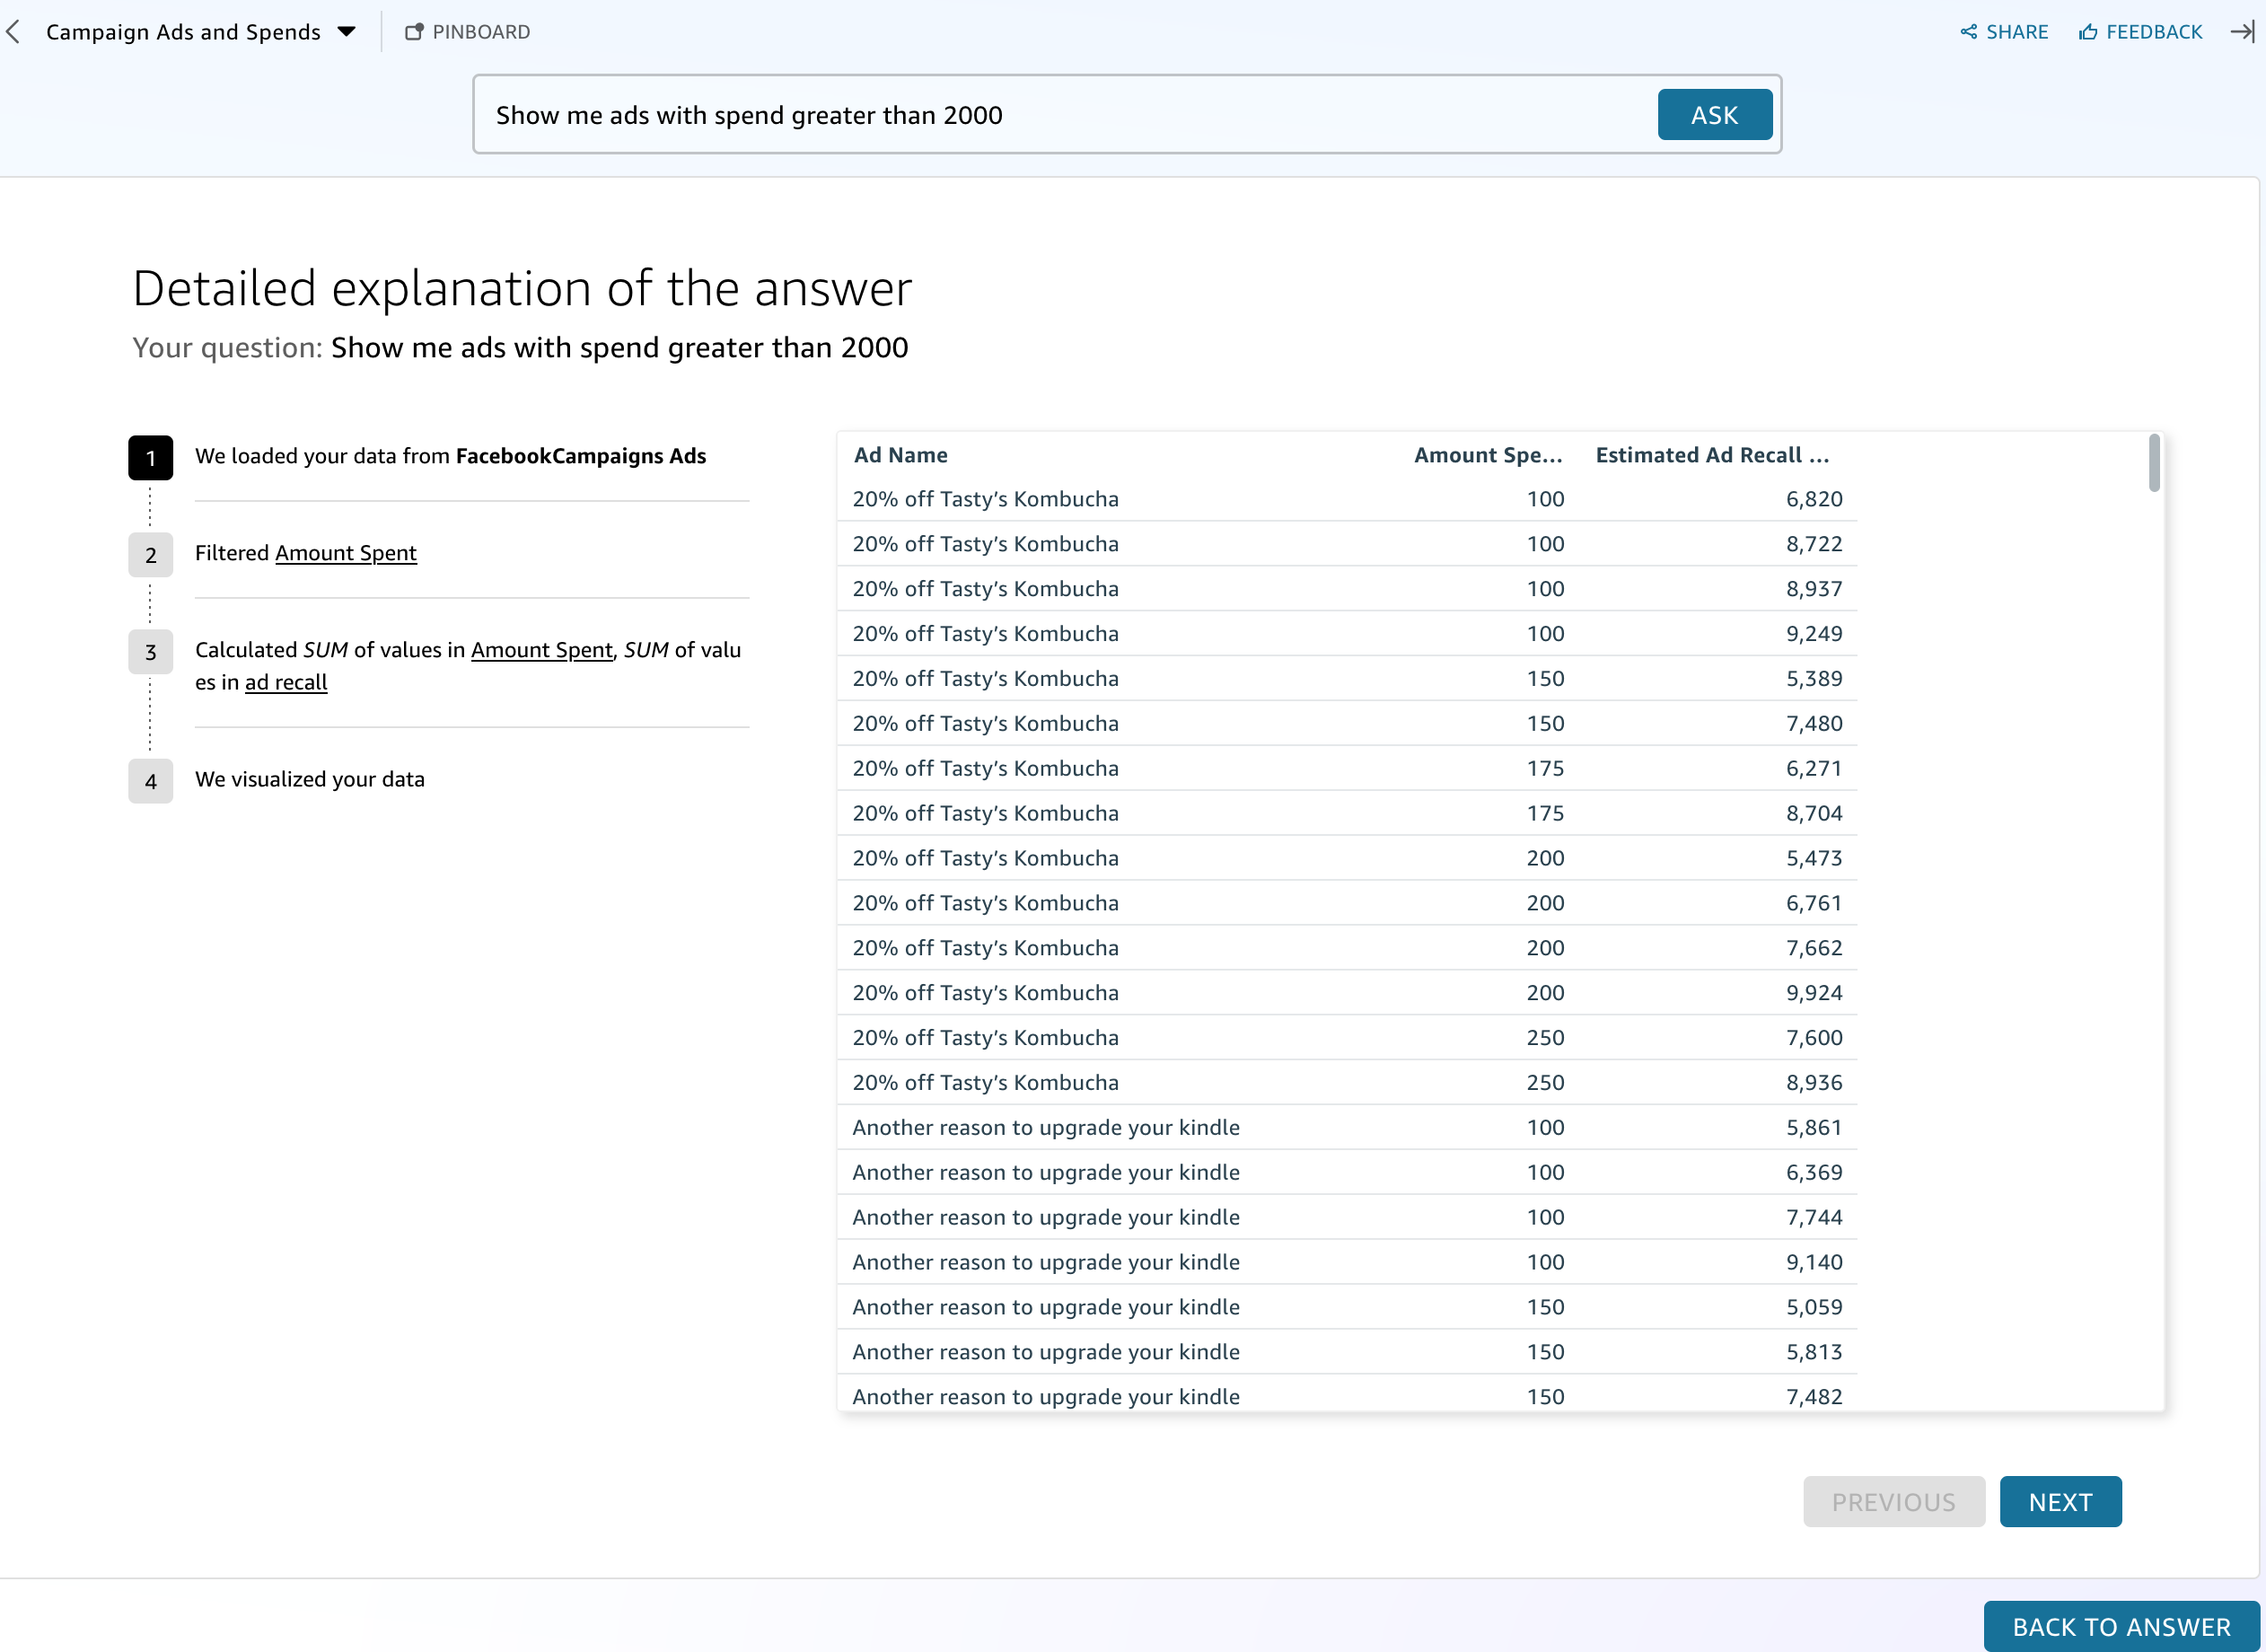
But how did it create the visuals?
- Hover over a visual and a small menu will appear in the top right corner
- Click on the three dots
- Select
View explanation - This will produce the steps taken to create the visual.
Generative BI Features
If your topic is well defined and you’ve tested it out, you can now use it in more advanced BI features, such as Data Stories, Dashboard Q&A, and Scenarios. We’ll try out the Data Stories feature. To do this you need to first create some visuals.
- In the quicksight home page, click on
Datasets - Select the same dataset you used to create your topic
- Click on
Create analysis - in the middle of the top of the screen you will see a Q symbol, click the three points next to it and select
Manage Q&A - Select
Use a linked topic for build visual and Q&A - Click the ‘build visual’ button in the top centre of the screen
- Type the type of visual you want to create, for example
bar chart of total spend by campaign name
(Make at least 3 visuals so we are better able to demonstrate the data stories feature)
Data Stories
Data Stories allow you to create a narrative around your data and present it to stakeholders. You can use the generative BI features to create a data story that includes visuals, text, and insights.
- Navigate to the
Storiestab in the left hand menu in the homepage - Click on
New storyin the top right corner - Describe your story, include context about the data and what you want to achieve with the story (who is the presentation for? what do they care about?)
- Select visuals that you think are relevant to what you want to present
- Click
build
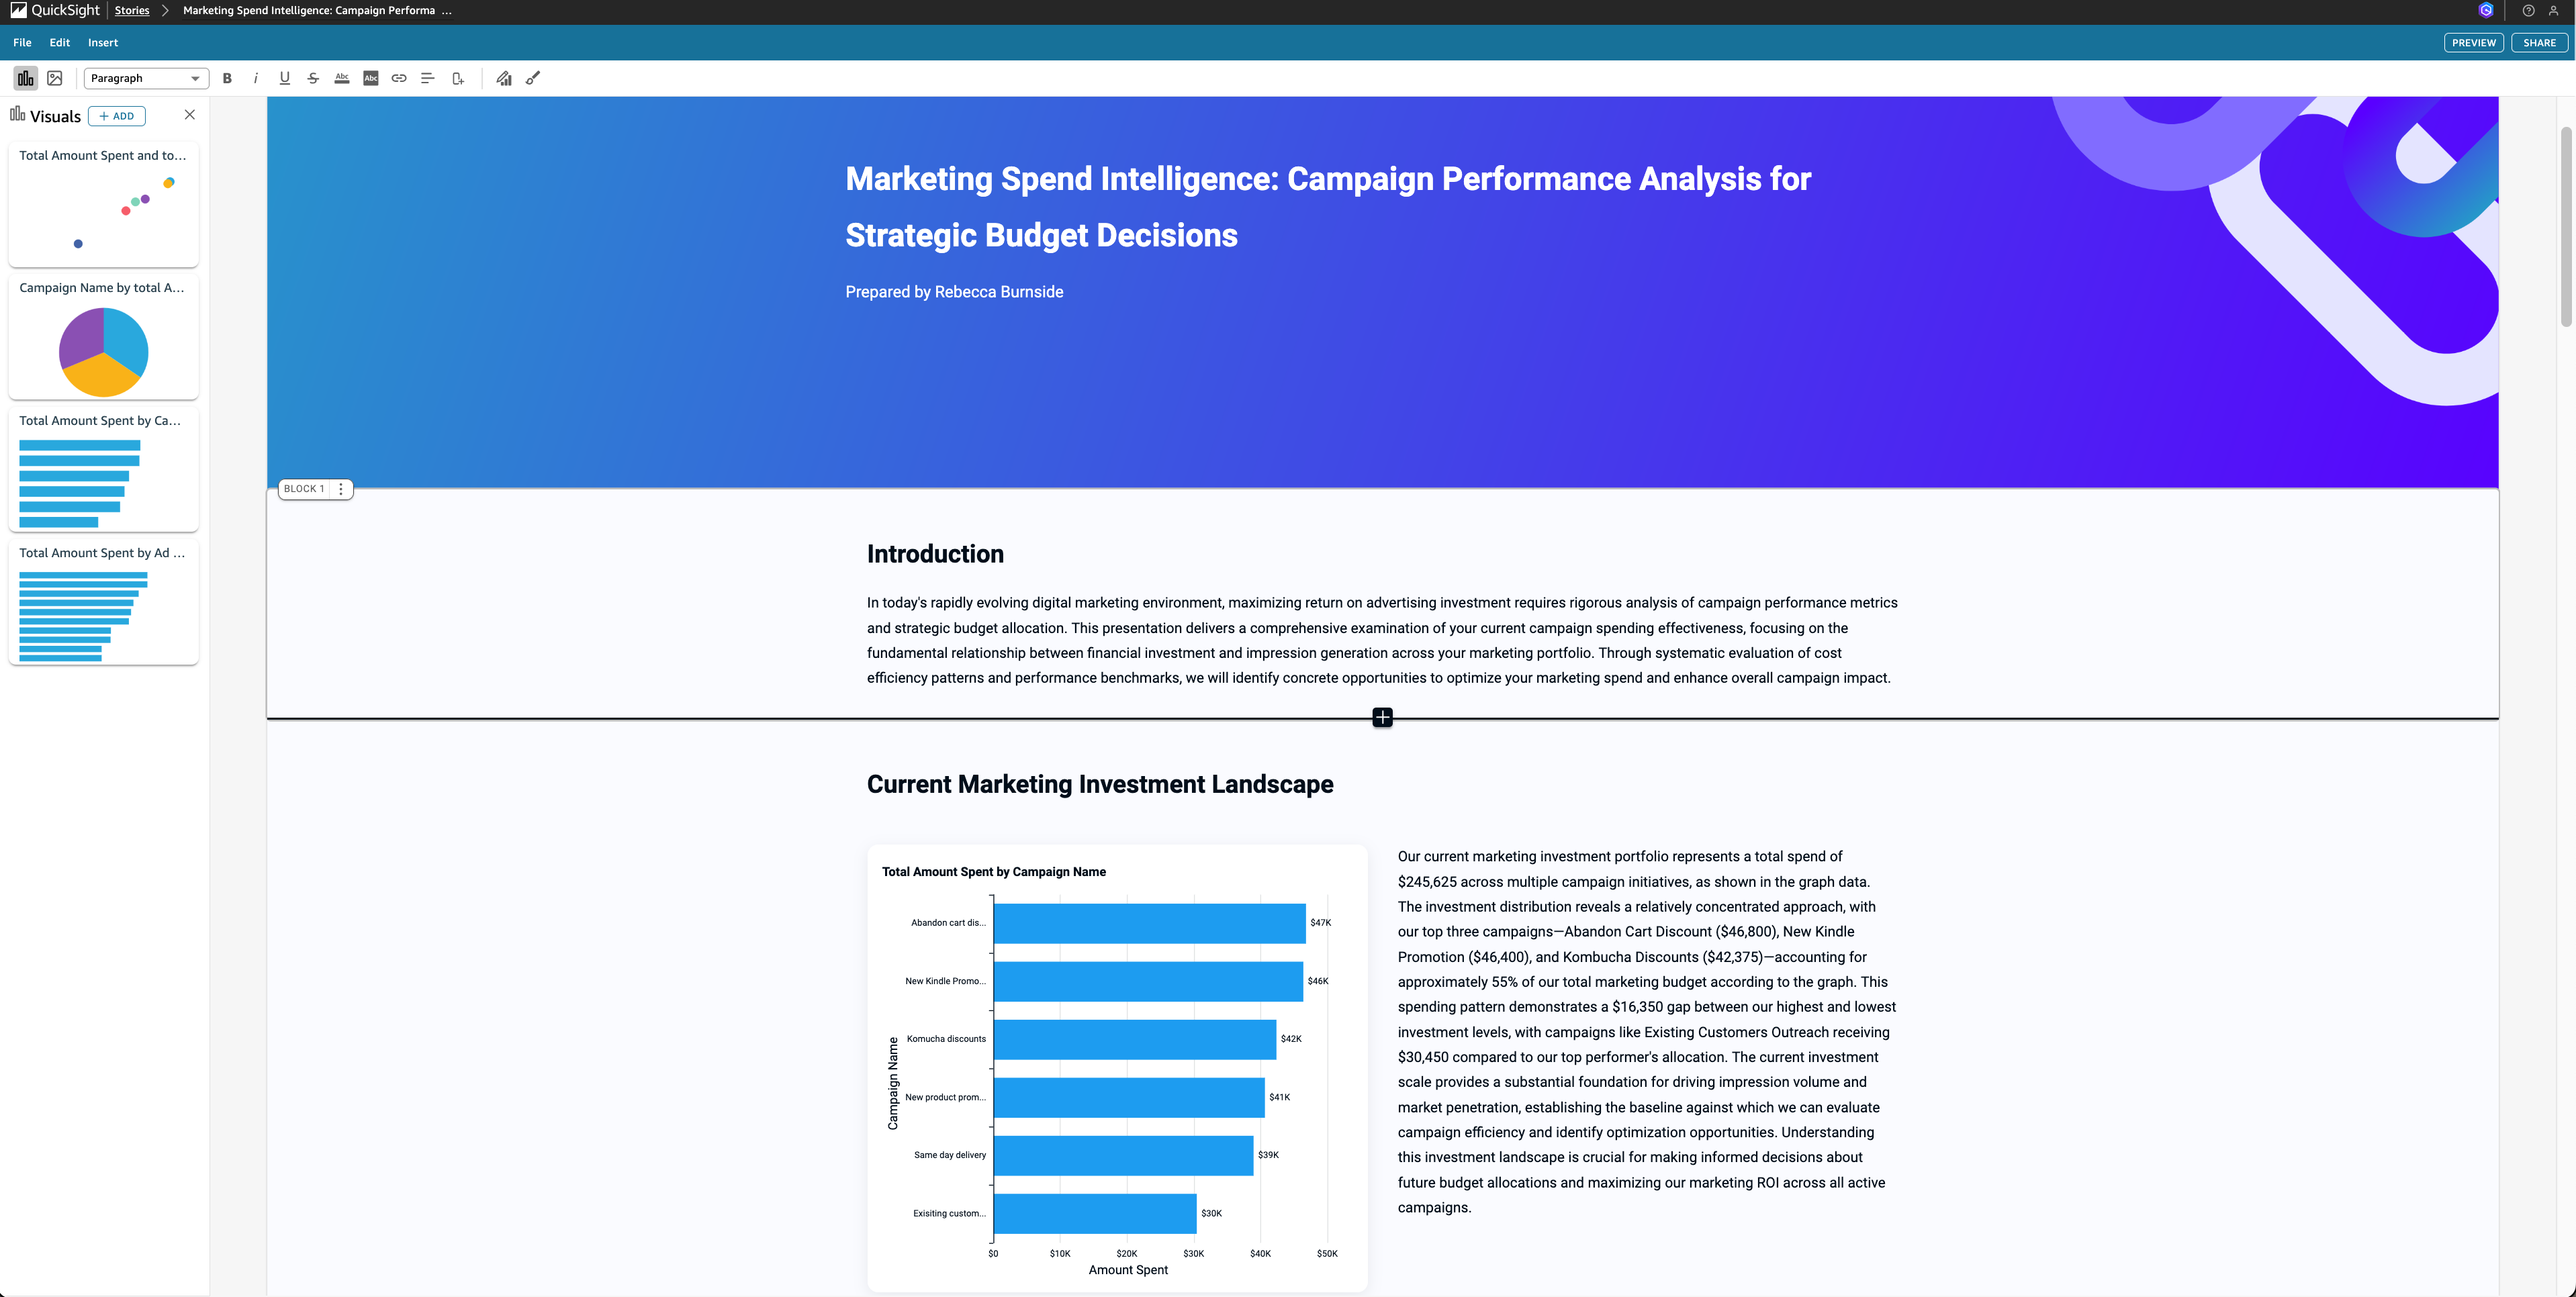
You’ll get a one page summary of your data accompanied with descriptive statistics and insights. You can edit the text, add or remove visuals, edit visuals, and change the layout to suit your needs.
If you don’t have many visuals, or the ones you’ve added don’t fit the story you are trying to tell, you will also get tips for improving your story, such as adding more context or suggestions for more specific visuals.
Summary and thoughts
That was a whirlwind introduction to generative BI and Quicksight Topics. There is a lot more to explore and learn, but this should give you a good starting point.
Since generative BI of this degree is in its infancy, there are some limitations to be aware of. Unsurprisingly, the quality of results can vary, sometimes the output is impressively accurate, other times less so. It’s important that a data analyst or someone with a strong grasp of statistics reviews and validates the results. Used by an experienced analyst it could be a useful tool in the early explorative phase of data analysis, or to speed up the process of generating executive summaries. It is not a replacement for a thorough examination of the data and its context.
What I appreciated is having a somewhat central place to document the data. This is better than not having any documentation at all, which is often the case in customer environments. Having a well defined topic with friendly names, synonyms, and descriptions is a good start, but ideally you would want to have a comprehensive, version controlled documentation strategy.
Honestly it feels pretty uncomfortable not to perform each step of the analysis yourself, because that’s typically where you catch mistakes or inconsistencies in the aggregated data. There is some level of explanation available for how the visuals were created, but it is not very detailed. Ultimately, you’ll need to decide which parts of your analysis you’re willing to trust it with, and which still require manual oversight.
Should you adopt Quicksight’s generative BI?
If you’re working in an environment where Quicksight Enterprise is already being used, it could be worth trialling the generative BI features for some time to see if they can add value to your data analysis and reporting processes. Generative AI tools to this point, seem to be best in the hands of experienced users who understand their limitations and can effectively guide their use. So if you have a team of tech-curious data analysts or BI professionals, they might be well placed to evaluate its usefulness. How you choose to measure success will depend on your specific use case and goals, but factors such as time saved, improved insights, and user satisfaction could be something to consider.

Rebecca is a Cloud Consultant at superluminar. After a career change from neuropsychology, she works in IT and is passionate about automation and data engineering. You can find her here on LinkedIn.